Java Tools Tutorials - Herong's Tutorial Notes - Version 5.32, by Dr. Herong Yang
What Is jvisualvm (Java VisualVM)?
This section describes the Java VisualVM 'jvisualvm', which is visual interface for viewing detailed information about Java applications while they are running on a Java Virtual Machine (JVM).
"jvisualvm (Java Java VisualVM)": Java VisualVM is a tool that provides a visual interface for viewing detailed information about Java applications while they are running on a Java Virtual Machine (JVM), and for troubleshooting and profiling these applications. Java VisualVM federates previously standalone tools like JConsole, jstat, jinfo, jstack, and jmap to obtain data from the JVM software, then re-organizes and presents the information graphically, to enable you to view different data about multiple Java applications uniformly, whether they are running locally or on remote machines.
Developers can extend Java VisualVM to add new functionality by creating and posting plug-ins to the tool's built-in update center.
Java VisualVM can be used by Java application developers to troubleshoot applications and to monitor and improve the applications' performance. Java VisualVM can allow developers to generate and analyze heap dumps, track down memory leaks, browse the platform's MBeans and perform operations on those MBeans, perform and monitor garbage collection, and perform lightweight memory and CPU profiling.
Java VisualVM was first bundled with the Java platform, Standard Edition (Java SE) in JDK version 6, update 7.
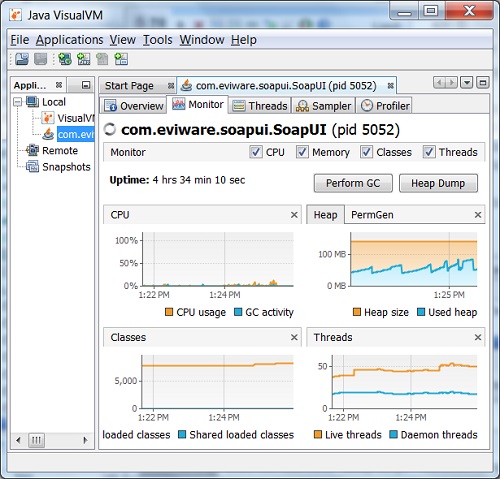
The picture below shows you a screenshot of Java VisualVM running the Monitor screen to watch
usages of CPU, heap memory, classes and threads:
Last update: 2015.
Table of Contents
'javac' - The Java Program Compiler
'java' - The Java Program Launcher
'jconsole' - Java Monitoring and Management Console
'jstat' - JVM Statistics Monitoring Tool
►jvisualvm (Java VisualVM) - JVM Visual Tool
►What Is jvisualvm (Java VisualVM)?
jvisualvm Command to Open Dump Files or Conections
Connecting Java VisualVM to a Local JVM Process
Monitoring Usgaes of CPU, Heap, Classes and Threads
Monitoring Thread Status as Timeline
Taking Thread Dump to See Thread Stack Traces
Taking Heap Dump to See Memory Usages
Connecting to Remote JVM Processes
Avaible Plugins and Installation
'javap' - The Java Class File Disassembler
'keytool' - Public Key Certificate Tool