Java Tools Tutorials - Herong's Tutorial Notes - Version 5.32, by Dr. Herong Yang
Avaible Plugins and Installation
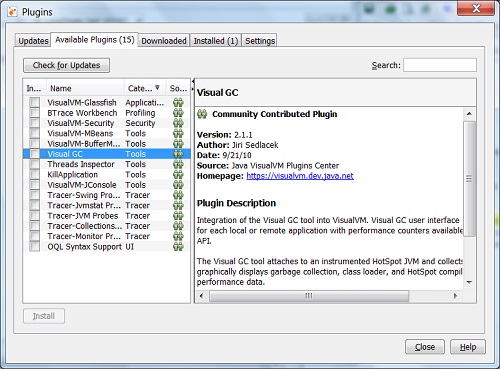
This section provides a tutorial example on how to view available plugins for Java VisualVM and how to install them.
Another nice feature of Java VisualVM is that it supports plugins. Try these steps to find out how many plugins are available at this moment and try to install one.
1. Run Java VisualVM and click "Tools > Plugins" menu. You will see the plugins dialog box.
2. Click the "Available Plugins" tab. You should see 16 plugins listed:
VisualVM-Glassfish
VisualVM-Extensions
BTrace Workbeanch
VisualVM-Security
VisualVM-MBeans
VisualVM-BufferMonitor
Visual GC
Threads Inspector
KillApplicaiton
VisualVM-JConsole
Tracer-Swing Probes
Tracer-Jvmstat Probes
Tracer-JVM Probes
Tracer-Collection Probes
Tracer-Monitor Probes
OQL Syntax Support
3. Check "VisualVM-Extensions" and click "Install" button.
4. Follow the installation steps to finish installing "VisualVM-Extensions" plugin.
The picture below shows the Java VisualVM plugin management window:
Last update: 2015.
Table of Contents
'javac' - The Java Program Compiler
'java' - The Java Program Launcher
'jconsole' - Java Monitoring and Management Console
'jstat' - JVM Statistics Monitoring Tool
►jvisualvm (Java VisualVM) - JVM Visual Tool
What Is jvisualvm (Java VisualVM)?
jvisualvm Command to Open Dump Files or Conections
Connecting Java VisualVM to a Local JVM Process
Monitoring Usgaes of CPU, Heap, Classes and Threads
Monitoring Thread Status as Timeline
Taking Thread Dump to See Thread Stack Traces
Taking Heap Dump to See Memory Usages
Connecting to Remote JVM Processes
►Avaible Plugins and Installation
'javap' - The Java Class File Disassembler
'keytool' - Public Key Certificate Tool