Java Tools Tutorials - Herong's Tutorial Examples - v6.24, by Herong Yang
jmc - JMX Console via MBean Server
This section provides a tutorial example on how to use 'jmc' JMX Console via MBean Server. The dashboard shows live meters of Used Java Heap Memory, JVM CPU Usage, and Live Set + Fragmentation.
To try Java Mission Control, I compiled and ran the Java program, GarbageCollection.java, presented earlier in the book:
herong> javac GarbageCollection.java

herong> java GarbageCollection
Free/total memory:
60130520   62914560
58098920   62914560
56853736   62914560
...
Now start "jmc" in another command window. I see "GarbageCollection" listed in the JVM Browser panel.
Open it and click its "MBean Server" object. I see the dashboard on the Overview tab in the details panel. It displays 3 live meters:
- Used Java Heap Memory - Shows heap memory maximum size and current usage.
- JVM CPU Usage - Shows the highest CPU usage the and current CPU usage.
- Live Set + Fragmentation - Shows the live set of heap and heap fragmentation. The live set consists objects survived an Major GC (Garbage Collection).
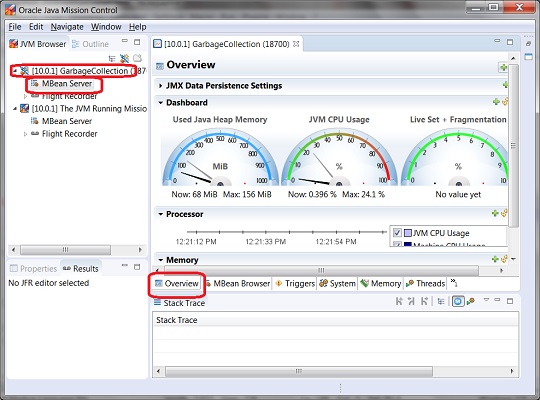
Table of Contents
javac - The Java Program Compiler
java - The Java Program Launcher
jpackage - Binary Package Builder
javadoc - The Java Document Generator
jdeps - The Java Class Dependency Analyzer
jdeprscan - The Java Deprecated API Scanner
jcmd - The JVM Diagnostic Tool
jconsole - Java Monitoring and Management Console
jstat - JVM Statistics Monitoring Tool
jhsdb - The Java HotSpot Debugger
jvisualvm (Java VisualVM) - JVM Visual Tool
jmc (Java Mission Control) - What Is It
Launching jmc (Java Mission Control)
►jmc - JMX Console via MBean Server
MBean Browser on jmc JMX Console
Monitoring Trigers on jmc JMX Console
javap - The Java Class File Disassembler
keytool - Public Key Certificate Tool
jrunscript - Script Code Shell
native2ascii - Native-to-ASCII Encoding Converter